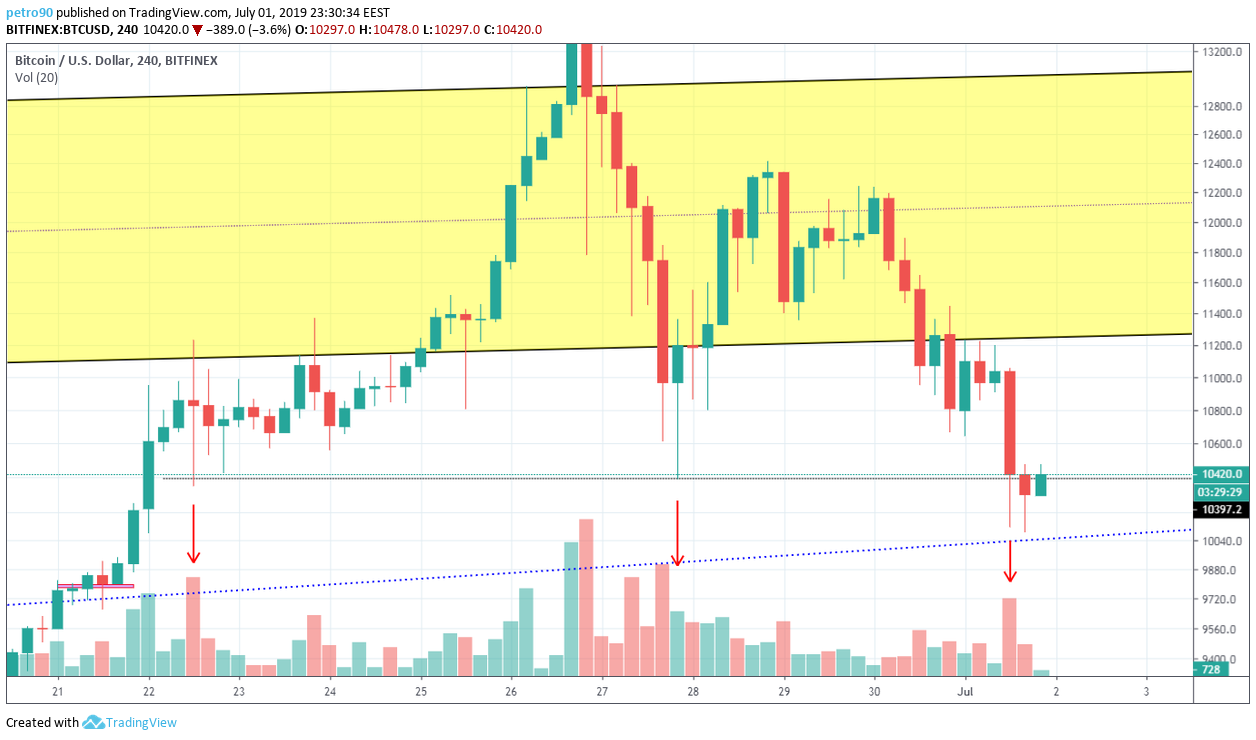
The new week, the new month and the new local low buyers have achieved today! Buyers failed to keep trades in the yellow price zone, and as early as 30 June, sellers left this zone and now are trying to break through an important price mark of $10,400. As a reminder, this is the price level sellers are trying to break through for the third time in 7 days:

Buyers are interested in this price and without an aggressive attack of sellers there won’t be continuation of the fall. At the moment, sellers have broken this level, but the price has sharply turned back, creating a false breakdown. After fixing the price below $10,400, sellers open up to $9,400. On the way to this target, there is a trend line in which the price in history was traded from May to the end of June.
But in our opinion, there is a little bit of liquidity between the prices of $10,400 and $9,400, and to emphasize this trend line as a stop or the probable place of price reversal isn’t something we’d do. The local critical point for sellers is at a price of $11,220. In addition to the local red trend line, which is now controlled by sellers, we see a small accumulation zone. After breaking through this, we should see an increase in the probability of breaking the yellow zone:

Marginal positions of buyers are decreasing, but no longer with speed:

After yesterday’s abnormal closing of marginal positions, sellers gradually came back to life and are trying to increase them:

In the wave analysis, we see the current fall as a correction, which consists of three waves:

Wave C = 0.618 * A and if sellers can break through $10,400 then the next serious seller problem will appear at a price of $9,000. If we look in detail at the nature of the fall in prices from 26 June, then we can see that the wave A is sharp and aggressive; the wave B consists of three smaller waves, and the wave C is weak enough and slightly sloping in contrast to the wave A.
If we give a brief summary, then the price is now between two critical points: $10,400 for buyers and $11,200 for sellers. After breaking through these prices, the probability of price movement towards the breakthrough is very high. Since now the trading volumes are gradually decreasing, the market becomes more manipulative and, in our opinion, it is wise to expect a real signal. Let’s see what should we expect in July, but for now, we will focus on this week!
BitcoinNews.com is committed to unbiased news and upholding journalistic codes of ethics. For more information please read our Editorial Policy here.
Follow BitcoinNews.com on Twitter: @bitcoinnewscom
Telegram Alerts from BitcoinNews.com: https://t.me/bconews
About the Author: Peter Oleshchuk is a trader and technical analyst.

He has spent two years studying and analyzing the crypto market.

Image Courtesy: Bitcoin News
The post BitcoinNews.com Bitcoin Market Analysis 2nd July 2019 appeared first on BitcoinNews.com.
from BitcoinNews.com RSS Feed
via TOday BItcoin New

0 Comments:
Post a Comment