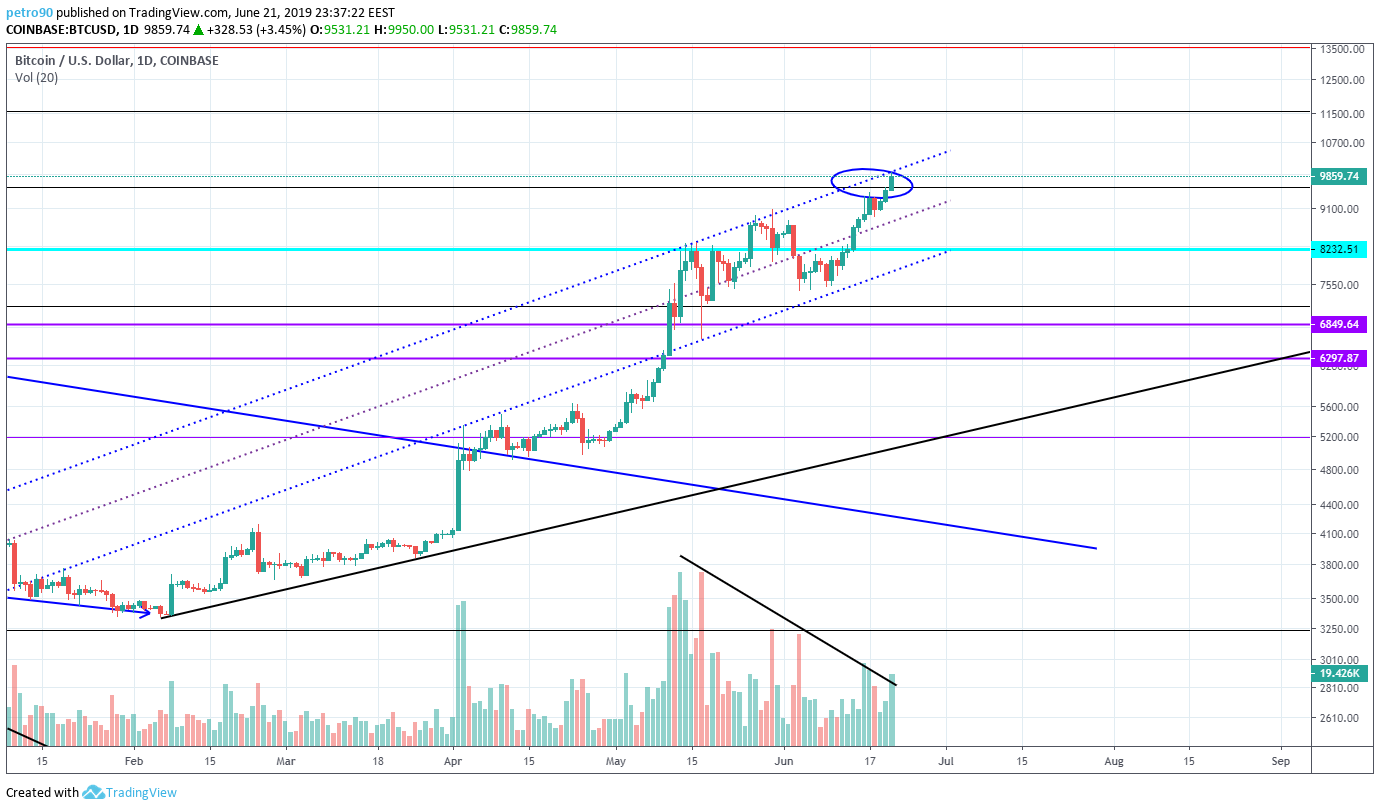
Buyers could not resist the temptation to continue the growth and, despite the lack of increased volumes, the critical price zone of USD 9300-9700 was successfully broken. Now buyers are trying to fix above the upper trend line of the channel, in which the price was traded from May 2019. We do not yet believe in the truthfulness of the trend line breakdown since the price on all the exchanges hasn’t broken this trend:

If you analyze the hourly timeframe, you can note that the buyers methodically and gradually passed the liquid zone. Of course, the volumes on the chart appear to be larger, but it is compared to volumes from 18-19 June, when the price stopped before USD 9300:

However, if you analyze volumes from 16 June, when buyers were not able to break through the yellow price zone, it becomes clear that now volumes are not bigger and such ease of buyers is a bit surprising.
Quite hot was the narrow price zone of USD 9770-9800. Near this price zone the volumes of both sellers and buyers are sharply increasing:

Pay attention to what efforts were needed to satisfy this zone, then we again see increased volumes in an attempt to break through this zone and, at the end of the breakthrough, sellers tried to change the situation, starting to aggressively sell it at increased volumes. This zone coincides with the upper trend line and we think that the fight is not over.
Buyers confidently increased their position today and reached the upper limit of consolidation:

Sellers also increased their positions, but within 10 days they also reached the upper limit of consolidation:

So far, sellers believe in a big chance of Bitcoin fall, however, if the price continues to grow – then by the way sellers will begin to close their positions, thereby increasing the growth of the coin.
The wave of growth continues to form on the wave analysis. Since buyers beat USD 9630 – the first serious level of resistance against the Fibonacci (38.2%), then the next stop for the price, in our opinion is USD 10900:

Everything in the weekly timeframe looks good for buyers. Let’s reiterate that there is a miracle that is amazing in volumes. If a weekly candle closes at USD 8900 – it will be a good signal of the start of the fall. However, nothing yet hints us about such a scenario.
BitcoinNews.com is committed to unbiased news and upholding journalistic codes of ethics. For more information please read our Editorial Policy here.
Follow BitcoinNews.com on Twitter: @BitcoinNewsCom
Telegram Alerts from BitcoinNews.com: https://t.me/bconews
About the Author: Peter Oleshchuk is a trader and technical analyst.
He has spent two years studying and analyzing the crypto market.

Charts Courtesy: TradingView
The post BitcoinNews.com Bitcoin Market Analysis 21st June 2019 appeared first on BitcoinNews.com.
from BitcoinNews.com RSS Feed
via TOday BItcoin New

0 Comments:
Post a Comment